Why a map outline and an area table disagree
You select a country and see an estimated area. A statistical table gives a slightly different figure. Which one should you trust? Start by asking what was measured: two accurate calculations can still describe different boundaries and different definitions of area.
A world map cannot show every inlet
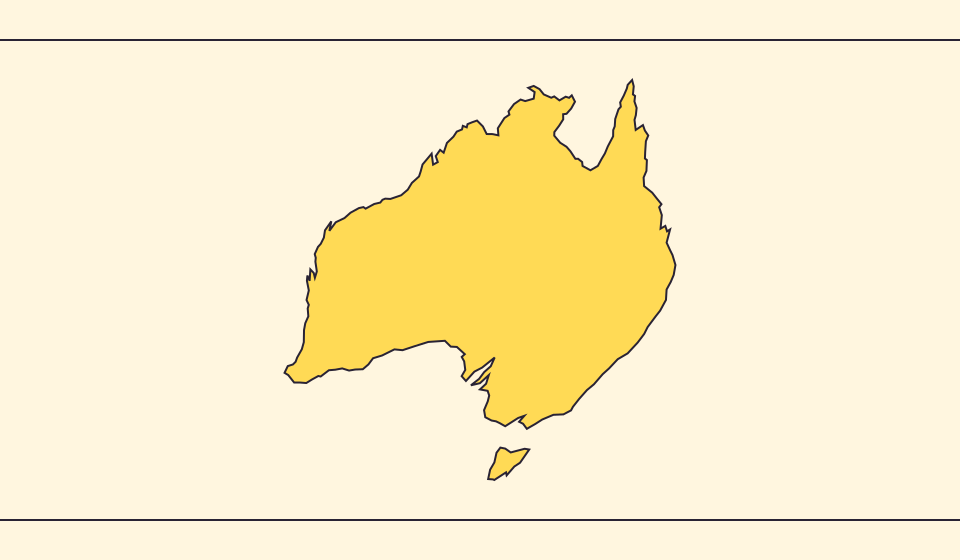
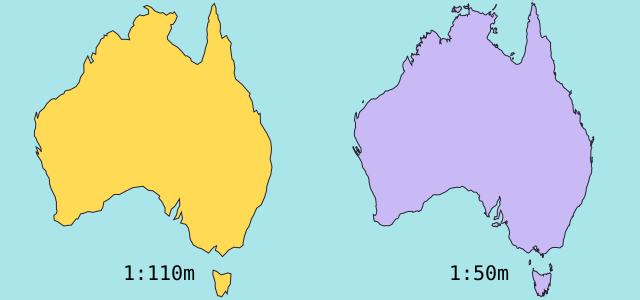
Natural Earth publishes geographic data at 1:10 million, 1:50 million and 1:110 million scales. The last is an overview scale: it reduces detail so a whole world remains legible. It is not simply a sharper map that happened to be saved at fewer pixels.
Zooming in enlarges the available outline; it does not add geographic detail that was omitted from the dataset. A small island missing at the source will remain missing. This is why the source scale matters even when the website lets you zoom freely.
Sources: Natural Earth · Dataset scales
Land area and surface area are different quantities
The World Bank’s land-area indicator excludes inland water bodies, while its surface-area indicator includes inland waters and some coastal waterways. A number labelled simply “area” can therefore conceal a meaningful choice. Check the indicator description rather than assuming every table uses the same convention.
Check territorial coverage too. Does a source count an overseas region separately? Are dependencies presented as their own entries? Before comparing countries or adding regions together, make sure the units and coverage are compatible.
Sources: World Bank · Land area: definition · World Bank · Surface area: definition
A geometric estimate is useful, with limits
In the Equal Earth atlas, RealWorldMap calculates the spherical area of the country polygon and multiplies it by the square of the mean Earth radius, 6,371.0088 km. The projection controls the drawing; the spherical geometry controls this estimate. Counting coloured screen pixels is not how the area figure is produced.
The ≈ mark is deliberate. The estimate inherits the boundary’s simplification and treats Earth as a sphere. It should help you understand scale, but it does not establish a legal border, property boundary or official national total.
Sources: D3 · Spherical area and distance
Match the definition before comparing decimals
A useful comparison starts with a short source note: dataset, publication year, unit, water coverage and territorial coverage. If those differ, a small disagreement may be expected. If they match and the disagreement is large, then investigate the geometry or calculation.
For a visual experiment, approximate outlines may be enough to reveal projection distortion. For a scientific or policy argument, replace that experiment with a documented measurement method. The appropriate level of precision depends on the question you want the number to answer.
Read a coastline at two source scales
- Compare the two Australian coastline outlines below.
- Look for small islands and bends that disappear in the simpler outline.
- Open Equal Earth, inspect an area estimate, then compare its definition with a statistical source.
More decimal places do not compensate for a different boundary or a different definition.
Open the map →
Common questions
Does zooming make the source boundary more accurate?
It makes existing geometry easier to inspect. It does not restore details omitted from the source.
Does an area discrepancy always mean a bug?
No. First compare source scale, water coverage, territorial coverage and the measurement method.
Sources and further reading
Sources checked:
Related stories
Japan and Germany: a long shape can hide a similar area
An island chain and a compact mainland country look very different. Compare area without confusing the sea between islands with land.
Five questions before sharing a “true world map”
Projection, zoom, viewpoint, source detail and the meaning of area all affect how you read a map. Check these before sharing a comparison screenshot.
Equal Earth: equal areas, different shapes
Equal Earth preserves relative area, but shapes still change. See what it preserves and when a globe helps.